
Thursday, August 17, 2017
Ticks and Trips: Tick Danger along the MI North Country Trail
We were planning the most recent UMich Tableau Users group and I heard that I was supposed to do a Ticks and Trips. Apparently, they actually said "Tips and Tricks" but my mind was already working. In no time I was combining Lyme Disease data from the CDC and journal articles with demographics data. In order to span much of the state I used the North Country Trail as my "trip" and I was off. I built this on the fly, incorporating many tips and tricks. One person in the audience raised her hand and told us that she got Lyme Disease hiking in the Western UP, exactly where my viz showed the highest probability.

Monday, January 23, 2017
Great Lakes Ice Cover
I had a discussion the other day about ice cover on the Great Lakes, which led me to searching out some data. Turns out the GLERL here in Ann Arbor has it, a lot of it. After I got it all downloaded and converted the shapefiles to CSV I loaded it up. Wow...there is a lot of it. about 150,000 rows per day, after removing land values, and I had from the 02-03 to 15-16 winters. Turned out to be about 180M rows, way more than the Tableau Public limit of 15M. I picked about 60 random days (8.2M rows) and included just them.
I tend to over complicate things and have to work hard to simplify, simplify, simplify!

I tend to over complicate things and have to work hard to simplify, simplify, simplify!
Thursday, June 9, 2016
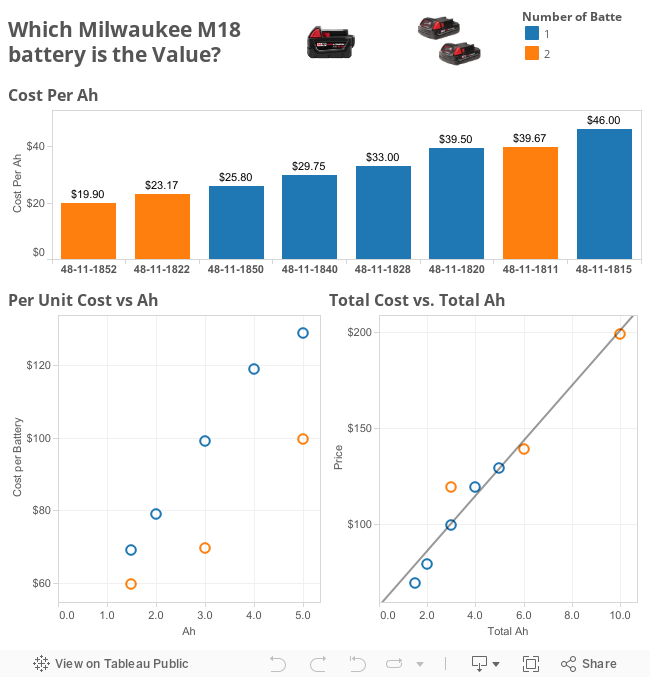
Milwaukee M18 Battery Value
Following this post over at ToolGuyd I did some copy/paste and came up with this analysis. I came to the same conclusion that the 5Ah batteries are the best value.
Thursday, April 21, 2016
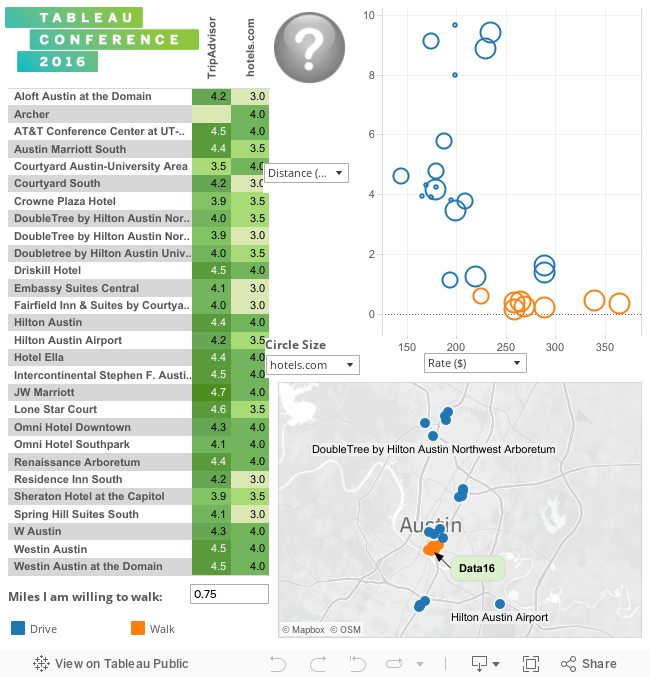
Where are you going to stay at #data16?
The Tableau Conference keeps getting bigger and bigger. Gone are the days when it fit in a single hotel. Now you have choices! To help decide which hotel to stay at (JW Mariott) I put together a viz containing location and hotels.com and tripadvisor reviews. You can decide on the right combination of distance, cost, and ratings. Some of the hotels were booked up when I tried.
Monday, April 11, 2016
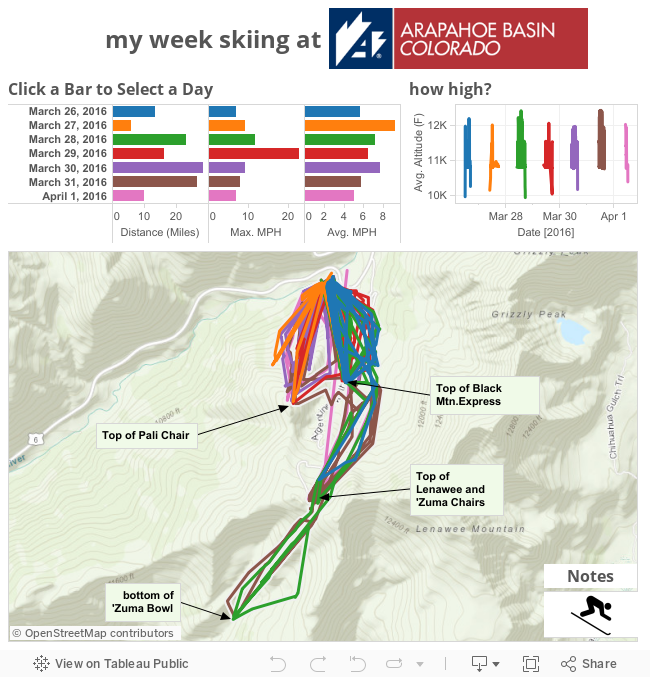
Spring Break Skiing
Over spring break my family went skiing in Colorado. When we got back I was looking at Moves and realized that it had been tracking my skiing. Fun with data below...
Recently I got a new iPhone. I have used some fitness tracking apps in the past, but my new phone (iPhone 6s) has a built-in pedometer and supports the app Moves. Since 2012 I have used OpenPaths but that is sporadic and only useful for general location.
Moves only recognizes walking, cycling and "transport" automatically. I had to reclassify some of the movements as 'downhill-skiing'. Since they were all in a tight geographic cluster it was pretty quick and easy using the app on the phone. The bummer is that it didn't differentiate riding the chairlift from skiing. Sometimes a movement was just a run or a chair, but most were multiple runs and chairs rides.
Ski data is all about elevation, but there was no relevant data captured. I dumped the timestamp, lat, and long into a webpage that can calculate elevation and added that as a second dataset. Next time I might use one of the ski specific tracking apps if better ski tracking isn't added to Moves.
Next step was to get it into Tableau, but the folks at Interworks already created a WebDataConnector for it, so that was a breeze.
Tuesday, March 15, 2016
Comparing the logged in user to the average
This example came up in a forum at work:
Before LOD calcs this was much harder and using row level security lets you limit to the logged in user. For this example I am:
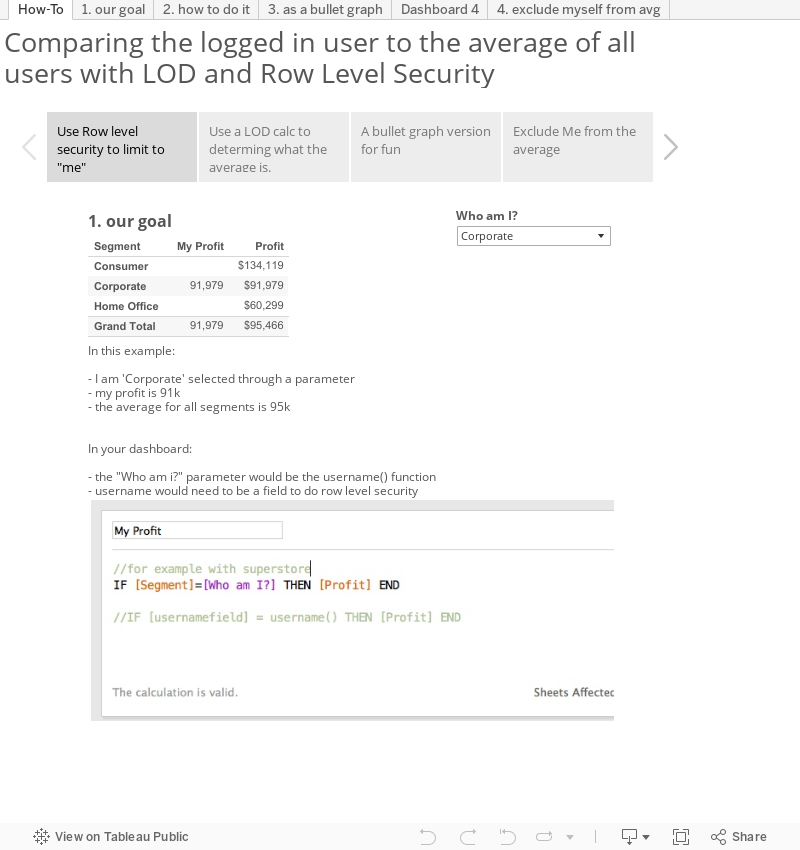
How can I have a dashboard compare "me" (the logged in user) to the average of all users?
Before LOD calcs this was much harder and using row level security lets you limit to the logged in user. For this example I am:
- using superstore data
- a parameter called 'Who am I?' stands in for the username() function
- the 'Segment' dimension is standing in for the field with usernames in it
- We are going to compare my (ie. the 'Corporate' segment) to the average of all the segments.
- Then a version where we exclude me from the average.
 |
My Profit
 |
| Average for all Segments |
 |
| This version excludes "me" from the average |
Tuesday, December 15, 2015
It has been a while since I put anything on Tableau Public, but when I saw that there was a #StarWarsData Contest I was in.
I ended up using the vehicle and starships dataset to make jawaslist. I generated about 500 ads using the Generate Data tool. It is really great and I have it running locally in MAMP to generate large datasets.
There are a few easter eggs in the ads. Some craft we are familiar with....

I ended up using the vehicle and starships dataset to make jawaslist. I generated about 500 ads using the Generate Data tool. It is really great and I have it running locally in MAMP to generate large datasets.
There are a few easter eggs in the ads. Some craft we are familiar with....
Subscribe to:
Posts (Atom)