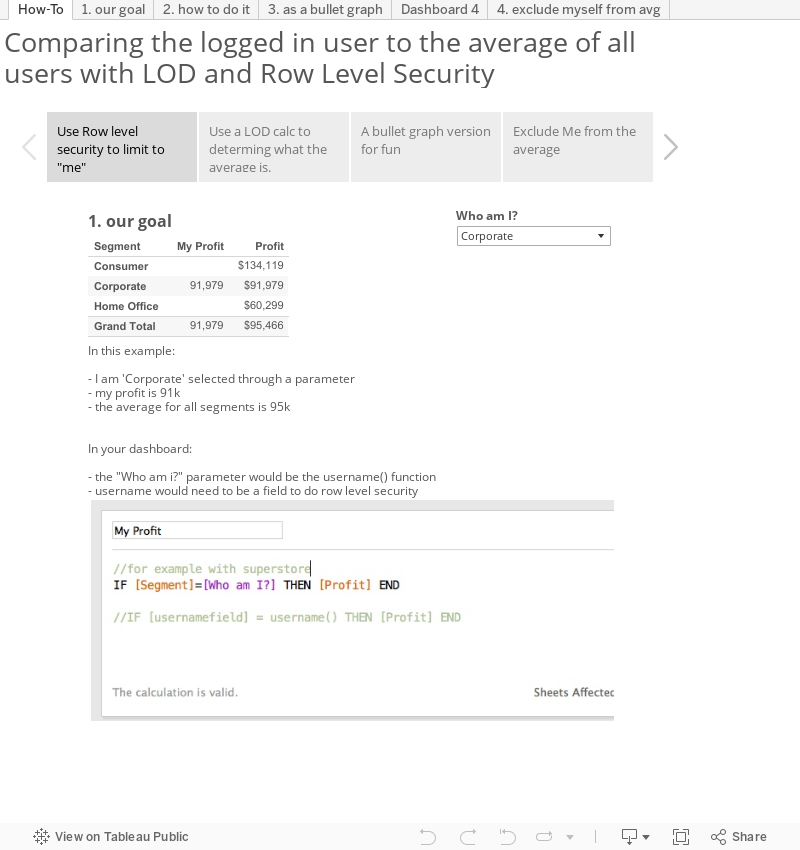
How can I have a dashboard compare "me" (the logged in user) to the average of all users?
Before LOD calcs this was much harder and using row level security lets you limit to the logged in user. For this example I am:
using superstore data
a parameter called 'Who am I?' stands in for the username() function
the 'Segment' dimension is standing in for the field with usernames in it
We are going to compare my (ie. the 'Corporate' segment) to the average of all the segments.
Then a version where we exclude me from the average.
My Profit
Average for all Segments
This version excludes "me" from the average
Tuesday, December 15, 2015
It has been a while since I put anything on Tableau Public, but when I saw that there was a #StarWarsData Contest I was in.
I ended up using the vehicle and starships dataset to make jawaslist. I generated about 500 ads using the Generate Data tool. It is really great and I have it running locally in MAMP to generate large datasets.
There are a few easter eggs in the ads. Some craft we are familiar with....
Being able to subscribe to views or workbooks was a huge added feature when it was added in Tableau v8.0. Users could get the info in their email on a schedule instead of having to go to the web page. Then came the questions....
"Can I get a notification when an extract updates?" No. "Can I subscribe a group?" No. "Can I sign other people?" No.
We do our best to let people know which schedule to choose.
I have seen people who get daily messages for a dashboard that updates monthly. Not only does the server have unnecessary load, but they get 29 extra emails a month.
I use Pentaho Data Integration to manage other Tableau Server tasks and I was working on notifying owners of when extracts failed and realized that the opposite would be to notify them when it is successfully updated.
I boiled what was subscribe-able down to 3 things:
Successful Workbook Extract Refresh
Successful Datasource Extract Refresh
Workbook Publish
The third is because there are some workbooks that are manually worked/QA'ed monthly and then published from a QA version to a Prod version. You might want to add a fourth if there are datasources you manually publish.
Watch the video for more details on how the Pentaho Job/Transform works, but the overview is:
Run Custom_Subscriptions.kjb Job, which deletes old images and launches the transform
Figure out what has happened and is actionable
Query Tableau Database to find actionable events
Join it to a table/file with a list of who is subscribed to what
Load some details for the view URLs
Generate the emails
Find unique views
run tabcmd to generate the images once for each subscribed dashboard
Email each person/group the image/content they are subscribed to.
I have two tables/text files containing
email addresses, subscribed object, site, etc
Details about the subscribed object (url, path, site, filetype)
We use Active Directory groups to control access, so most dashboards already have a corresponding group that we can email. This prevents having to manually manage individual users.
There is also a #DATA15 session on how they do this at Tableau and I am really excited about seeing this. Maybe they will announce that it will be a new feature in Tableau 10.
This will be my fifth Tableau Conference, and every year I get questions from people. They want to know what sessions to take, which ones to avoid, and what they can't miss.
Have Fun. I know this should go without saying, but have fun. There are going to be great parties, events, speakers, and conversations. Get enough sleep (tough for us used to EST). I try to get all my work related stuff done between the time I get up at 4am and breakfast at 7. That way I don't have to worry about work and can focus on the conference.
Wear comfortable shoes and clothing. The MGM Grand is huge and the conference is twice the size of last year. You are going to walk all over and should be comfortable.
Don't carry too much stuff. I try to have a minimal load with me: a small backpack, iPad, power pack/cable, and a water bottle. Don't be that guy with the huge bag who comes late/leaves early and has to slide past 20 people to a seat, banging a bag against everyone. Or even worse takes a seat with your bag. Which brings me to...
Have options. Find a few sessions for a time slot so if one fills up you have a fallback. Many sessions will fill up and turn people away. Slide in to make room. You might need to skip a session, or leave early to get to your next one. Chances are some sessions you want are going to be full so...
Some sessions are best experienced. I am thinking of IronViz, PimpMyViz, and the keynotes. The sessions are usually recorded live, or before hand, so you can catch others online.
Talk to people, the great thing about a software-specific conference is that everyone uses, or is thinking about using, Tableau. Ask them where there are from and how they use it. You can gain new perspectives, and meet people that you can connect with later. The conference is really big now, so knowing people makes it more fun. TC11 was about 1200 people. I was constantly running into the same people over and over; not so much these days.
Last year they gave out backpacks at registration. If you plan on using it make sure you have some way of identifying yours from the 10,999 others. Better yet, use your own.
Help is everywhere, to mixed degrees. Tableau has exploded over the past few years so there are many people working there that have less experience than me. If you want to ask esoteric questions go to one of the meet-ups and talk to the developers at the Data Doctor. There are information desks everywhere and people are generally helpful.
Food is also everywhere. Going somewhere new can be scary. Breakfast and lunch are provided. There are some events in the evening (with drinks) that may count as a meal, depending on who you are, and how much you eat. There are also usually snacks available during the day at Bits and Bytes and at the Bar Chart. Lines can be long, but hopefully Vegas is good at dealing with swarms of people.
This afternoon a colleague and I were discussing text analysis and how there isn't a good way to do it in Tableau. We have seen demos for tools like Oracle Endeca that are all about analyzing unstructured text. An example that was often given was using it against doctors notes. The other is for occurrences of keywords.
I was able to use a "Split Fields to Rows" transform in Pentaho to make a row for each word and generate the viz below. I excluded numbers, and some common words like 'Tableau'. I also used a Stop Word List to exclude common words.
UPDATE: This article is pointless now that Tableau Server does this out of the box. It is nice that they roll out so many enhancements so I don't have to make (and support and maintain) as many hacks. Our Tableau server has (at the moment) 28 sites spread over as many departments. Newer (v8+) versions of Tableau Server do a better job of notifying if a workbook failed when logged in, but there still isn't a good way to get them pushed out. Site Admins can look at the system dashboards to see failed extracts, but that doesn't help users who only publish. I was getting sick and tired of sending people email saying "your extract keeps failing because of X. Please fix it or I will disable it." Cutting down on these failed extracts becomes especially important when they hit the backgrounder.querylimit (default is 2 hours), which means they occupied one of the backgrounders for 2 hours with nothing to show for it. I have a couple dashboards that tell me about chronic offenders, but the single most effective tool has been sending automatic notifications to the owner of a workbook or datasource when it fails. To accomplish this I used Pentaho Data Integration to:
Query the internal Tableau Server database to find failed extracts and the owner.
Email the owner.
See your failed extracts diminish.
The SQL looks for the last hour, so you will need to adjust that if you plan to run on a different schedule.
I have been using Pentaho Data Integration for a while at work to ETL data here and there, but have also been finding it useful for managing our Tableau Server. I wanted to share some of this work so here is the first one.
I know that Tableau Server 9.1 can now automatically sync AD groups. If you are running an older version this might be useful. You could also use this as a starting point for some other purpose. Run it on a schedule to keep your groups synced.
We had a script prior to this that we would add groups to. The issue was we have 28 sites on our server and only a small percentage of the total groups made it onto the script. This way everything stays in sync.
Basically it:
Queries the internal Tableau Server DB and comes back with a list of all the AD groups in all the sites.
It then compares the results to a blacklist csv file and filters out any on the blacklist.